

Market Analysis Brief | Updated August 2026
Primary data sources: Dayton REALTORS® MLS and Realtor.com
Key takeaway: July 2026 data points to a steady, moderately appreciating market across Montgomery and Greene Counties. Prices remain firm, closed sales are increasing, and inventory is higher than a year ago. Buyers have more opportunities and negotiating leverage than during the most competitive market conditions, while well-priced homes can still attract strong demand.
The regional market is active: but more balanced
The Dayton-area housing market continued to show resilience in July. According to the Dayton REALTORS® July 2026 MLS report, the median sale price reached $275,000, up 1.85% from July 2025. The average sale price rose 2.69% to $312,609.
Sales activity also improved. Closed sales increased 5.85%, while new listings rose 3.15%. That combination is important: demand is active, but supply is also expanding.
Regional snapshot: Dayton-area MLS
| Metric | July 2026 | July 2025 | Year-over-year change |
|---|---|---|---|
| New listings | 1,901 | 1,843 | +3.15% |
| Closed sales | 1,537 | 1,452 | +5.85% |
| Median sale price | $275,000 | $270,000 | +1.85% |
| Average sale price | $312,609 | $304,424 | +2.69% |
| Total sales volume | $480.5 million | $442.0 million | +8.70% |
| Sale-to-list price ratio | 100% | 100% | No change |
| Active homes and condos | 2,817 | 2,357 | Approximately +19.6% |
| Estimated inventory supply | 1.8 months | : | More choice than last year |
Year to date through July, the median sale price was $264,900, up 3.88%, and closed sales totaled 8,651, up 4.12%. The year-to-date sale-to-list ratio remained at 100%, indicating that sellers are still receiving offers close to asking price when properties are positioned appropriately.
Chart: July 2026 year-over-year movement
Closed sales          +5.85%  ██████████████████
New listings          +3.15%  ██████████
Average sale price    +2.69%  ████████
Median sale price     +1.85%  ██████
The chart reflects a market where transaction activity is growing faster than prices. That pattern generally indicates healthy demand accompanied by improving supply, rather than a market driven primarily by rapid price escalation.
What Realtor.com adds to the picture
Realtor.com data for the Dayton metropolitan area presents a similar but slightly more buyer-friendly view:
- Median list price: $249,995, down approximately 2.0% year over year
- Median days on market: 39 days, up 6.2%
- Active listings: up 24.6% year over year
- Listings with price reductions: 26.5%
- National median list price: $428,950
These figures should not be compared directly with MLS sale-price statistics because they measure different points in the transaction. MLS data tracks completed sales, while Realtor.com emphasizes asking prices and active listings.
Market interpretation: Sellers cannot rely on broad appreciation alone. Buyers should not assume every property is negotiable. Pricing, condition, location, and marketing quality are creating larger differences between individual homes.
Miamisburg: Limited inventory continues to support demand
For buyers searching for homes for sale in Miamisburg, July market indicators show one of the tighter conditions among the featured communities.
| Miamisburg indicator | July 2026 snapshot |
|---|---|
| Median listing price | $285,475 |
| Active listings | Approximately 159 |
| Median days on market | 27 |
| Median listing price per sq. ft. | $157 |
| Year-over-year inventory trend | Down approximately 9.77% |
Other market estimates place typical home value near $268,802 and active listings closer to 144, depending on the data set and property types included. The difference illustrates why buyers and sellers should evaluate several metrics rather than rely on one automated estimate.
Miamisburg’s combination of limited inventory, a 27-day median market time, and pricing above the Montgomery County listing median suggests continued competition for homes that are updated, correctly priced, and located in desirable neighborhoods.
For sellers, preparation and pricing remain essential. For buyers, early alerts and prompt showings may be more important in Miamisburg than in areas with expanding inventory.
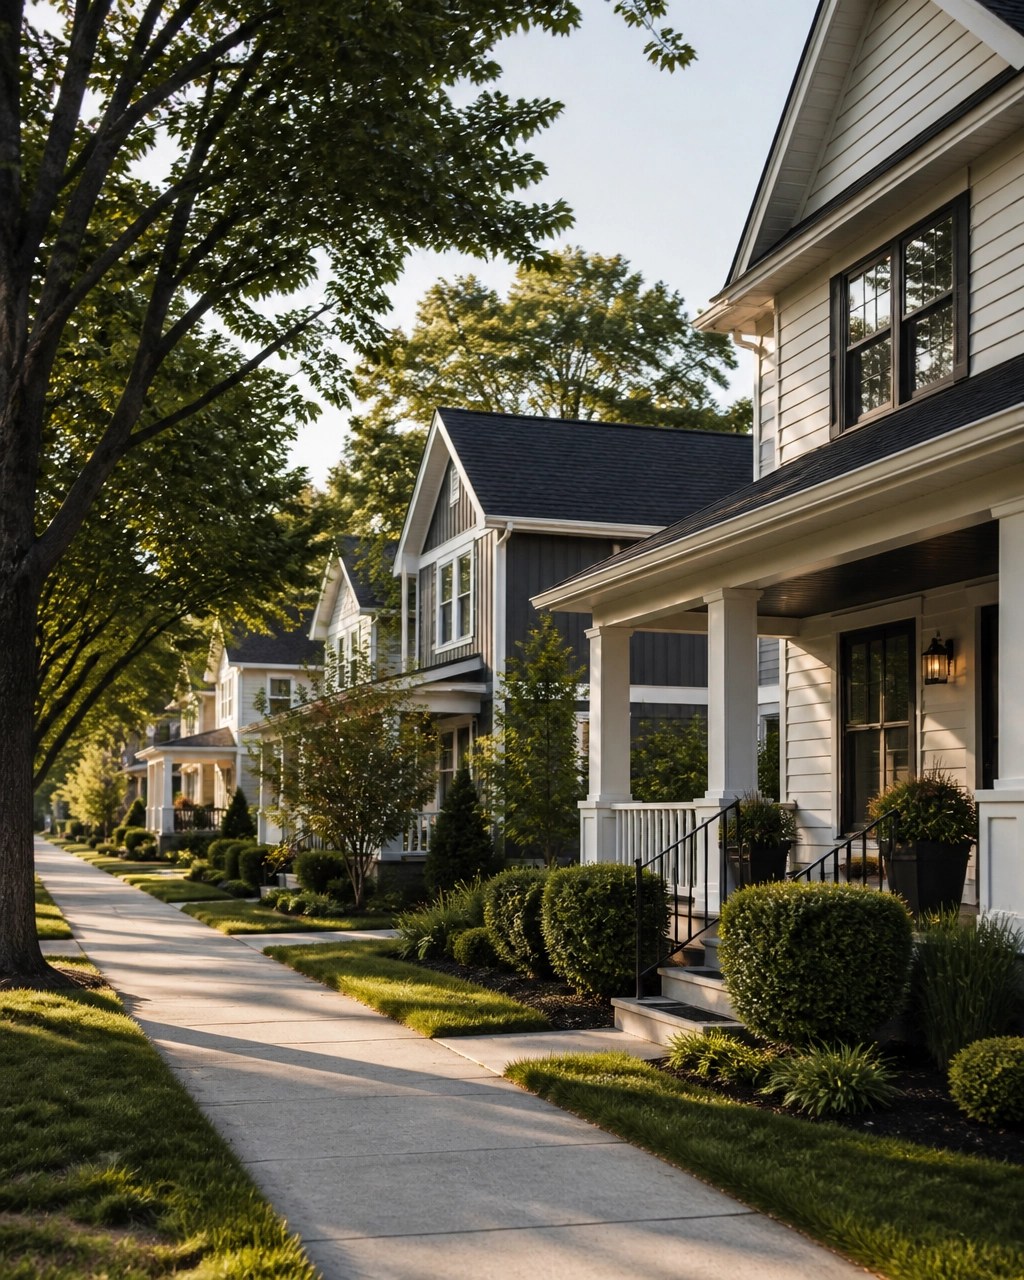
Huber Heights: More listings, supported employment demand
The Huber Heights market is benefiting from its proximity to Wright-Patterson Air Force Base, regional employers, and major transportation routes. Those fundamentals help support demand from military personnel, relocating professionals, commuters, and households seeking attainable suburban housing.
| Huber Heights indicator | July 2026 snapshot |
|---|---|
| Median listing price | $278,950 |
| Active listings | Approximately 151–168 |
| Median days on market | 33 |
| Median listing price per sq. ft. | $152 |
| Year-over-year inventory trend | Up approximately 21.48% |
Community data from 2025 recorded 585 closed sales, an average sale price of $237,883, and a median sale price of $222,500. These annual figures are not identical to the July 2026 listing snapshot, but they provide useful context for the community’s price positioning.
The increase in active listings gives buyers more selection than last year. However, 33 median days on market remains a relatively active pace. Buyers should be prepared to compete when a property offers a convenient commute, functional floor plan, and value at its price point.
Sellers should avoid overpricing simply because demand remains present. More competing listings mean buyers can compare condition and price more carefully.
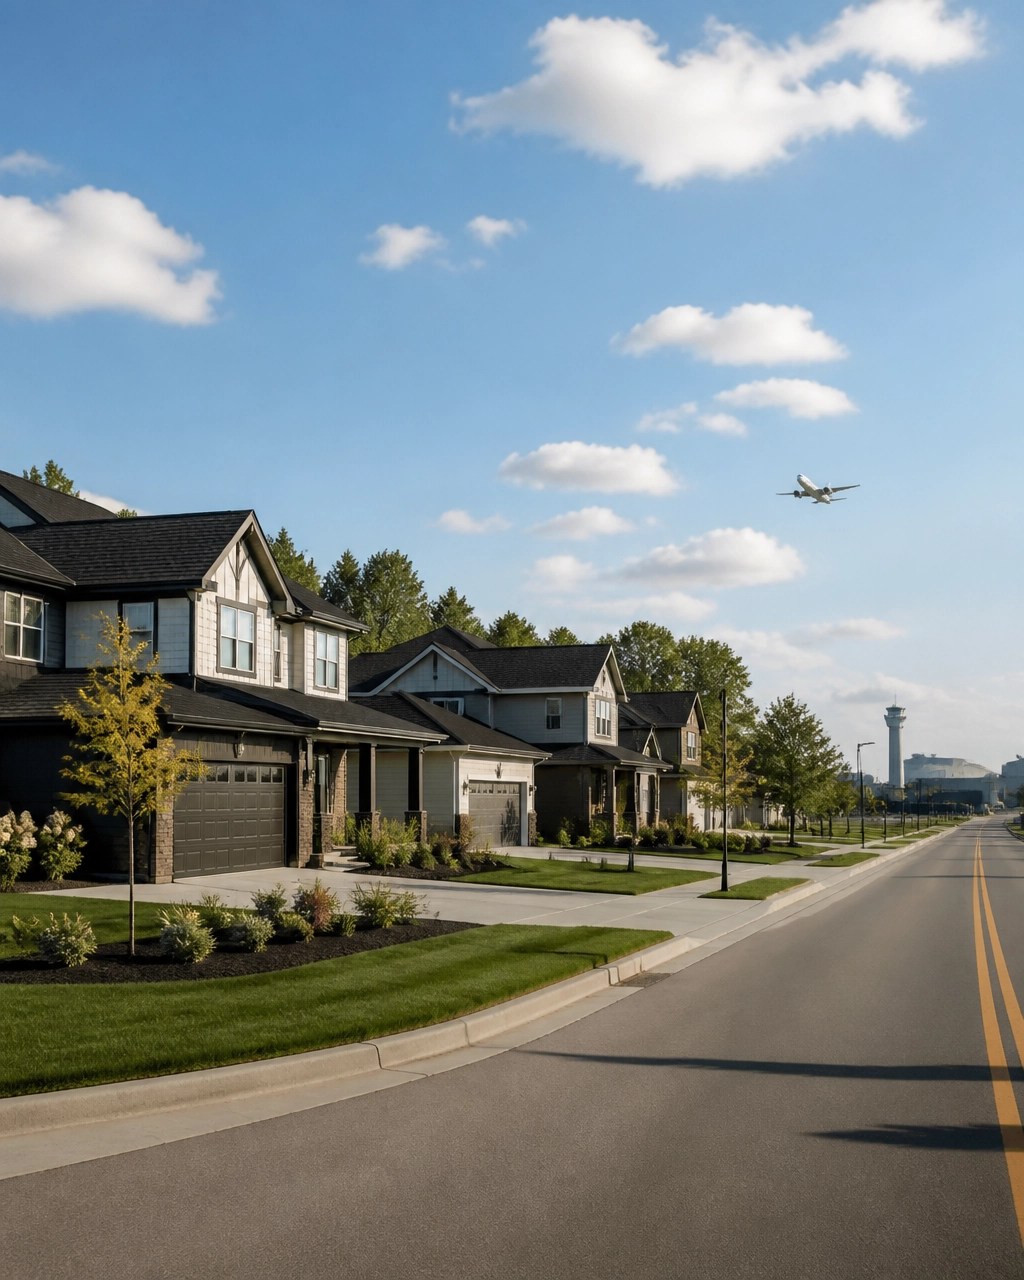
Xenia: Stable Greene County demand and value positioning
Those researching Xenia houses for sale will find a market with steady activity and a somewhat longer decision window than Miamisburg.
| Xenia indicator | July 2026 snapshot |
|---|---|
| Median listing price | $309,950 |
| Active listings | Approximately 177 |
| Median days on market | 39 |
| Median listing price per sq. ft. | $178 |
| Year-over-year inventory trend | Down approximately 6.90% |
Xenia recorded 469 closed sales in 2025, with an average sale price of $262,787 and a median sale price of $235,000. Demand is connected to Dayton-area employment, access to surrounding communities, and value positioning within Greene County.
The year-over-year decline in active inventory suggests that supply has tightened in the Xenia submarket, even though the median market time is 39 days. Buyers may have more time to evaluate a home than they would in Miamisburg, but attractive properties can still move quickly.
Sellers should focus on accurate comparable sales, condition, and presentation. Buyers should compare not only the list price but also property taxes, insurance, maintenance needs, and the cost of any improvements.
Montgomery County vs. Greene County
The county-level figures show meaningful differences in pricing and inventory. Portal-based county data can use different definitions than MLS reports, so these figures are best used for directional comparison.
| Indicator | Montgomery County | Greene County |
|---|---|---|
| Median listing price | Approximately $199,900 | Approximately $361,750 |
| Year-over-year listing-price change | -6.63% | +7.98% |
| Median sold price | Approximately $232,000 | Approximately $330,000 |
| Year-over-year sold-price change | +3.59% | +3.16% |
| Active listings | Approximately 2,639 | Approximately 781 |
| Year-over-year active-listing change | +15.80% | +12.32% |
| Median days on market | 38 | 39 |
| Median price per sq. ft. | Approximately $140 | Approximately $175 |
| Sale-to-list ratio | Approximately 100% | Not provided |
Montgomery County offers a broader range of entry-level and mid-market housing, while Greene County’s higher median listing figure reflects its specific mix of communities and available properties. The Realtor.com Montgomery County market page provides additional portal-based market context.
For a broader local discussion, see the August 2026 Montgomery and Greene County market snapshot.
Practical guidance for buyers
1. Use the additional inventory strategically
More listings and 26.5% price-reduction activity in the Dayton metro give buyers more options. That does not mean every seller will accept a discount. Focus negotiations on measurable issues such as needed repairs, extended market time, comparable sales, or a price that exceeds the home’s condition.
2. Compare monthly payment: not only purchase price
Mortgage rates, taxes, insurance, and maintenance costs all affect affordability. A lower-priced home may require significant repairs, while a higher-priced property may offer lower near-term maintenance costs.
3. Search by community and commute
Whether comparing homes for sale in Huber Heights, Miamisburg, or Xenia, evaluate commuting routes, employment access, property taxes, and neighborhood inventory. Relocating professionals should review these factors before narrowing a search based only on list price.
Practical guidance for sellers
1. Price from current comparable sales
Automated estimates are not a substitute for a local comparative market analysis. They may not fully account for renovations, condition, lot characteristics, or micro-market differences.
2. Prepare for a more selective buyer
Buyers have more choices than last year. Clean presentation, functional repairs, professional photography, and a defensible list price can help a property stand apart.
3. Monitor the first two weeks
Early showing activity, online engagement, and buyer feedback provide valuable evidence. If activity is weak, a timely strategy adjustment is usually more effective than waiting for market momentum to change.
Practical guidance for investors
Investors should examine each property at the neighborhood level rather than applying county averages broadly. Review:
- Purchase price compared with recent sold properties
- Rent potential and vacancy assumptions
- Property taxes, insurance, utilities, and maintenance
- Estimated renovation costs
- Long-term employment and transportation access
- Resale demand and price-per-square-foot trends
Miamisburg may appeal to investors seeking tighter inventory and faster market times. Huber Heights offers employment-related demand and a larger inventory base. Xenia may provide value-oriented opportunities, but careful property-level analysis remains essential.
Investor reminder: A strong market does not automatically produce a strong investment. Cash flow, condition, financing, and exit strategy must work together.
Conclusion: A market that rewards precision
July 2026 data shows that Montgomery County Ohio real estate and the Greene County Ohio real estate market are active, stable, and moderately appreciating. Closed sales are rising, prices remain firm, and inventory has improved. At the same time, longer market times and price reductions indicate that buyers are becoming more selective.
Miamisburg currently shows tighter supply and faster movement. Huber Heights offers expanding inventory supported by employment access. Xenia remains a steady Greene County option with value-oriented demand and a 39-day median market time.
Whether you are evaluating xenia houses for sale, homes for sale in Huber Heights, or a property elsewhere in Montgomery or Greene County, current data should guide the decision: not national headlines or generic estimates.
Contact Johnson Webb Realty today for current listings, a free home valuation, or a local market report tailored to your property goals.
Market data is subject to change and should be independently verified. County and city figures may reflect different reporting periods, property types, and methodologies than Dayton REALTORS® MLS statistics.